5th USENIX Conference on File and Storage Technologies - Paper
Pp. 17–28 of the Proceedings
Failure Trends in a Large Disk Drive Population
Eduardo Pinheiro, Wolf-Dietrich Weber, and Luiz André Barroso
Google Inc.
1600 Amphitheatre Pkwy
Mountain View, CA 94043
{edpin,wolf,luiz}@google.com
Abstract
It is estimated that over 90% of all new information produced in the
world is being stored on magnetic media, most of it on hard disk
drives. Despite their importance, there is relatively little published
work on the failure patterns of disk drives, and the key factors that
affect their lifetime. Most available data are either based on
extrapolation from accelerated aging experiments or from relatively
modest sized field studies. Moreover, larger population studies
rarely have the infrastructure in place to collect health signals from
components in operation, which is critical information for detailed
failure analysis.
We present data collected from detailed observations of a large disk
drive population in a production Internet services deployment. The
population observed is many times larger than that of previous
studies. In addition to presenting failure statistics, we analyze the
correlation between failures and several parameters generally believed
to impact longevity.
Our analysis identifies several parameters from the drive's self
monitoring facility (SMART) that correlate highly with failures. Despite
this high correlation, we conclude that models based on SMART parameters
alone are unlikely to be useful for predicting individual drive failures.
Surprisingly, we found that temperature and activity levels were much
less correlated with drive failures than previously reported.
1 Introduction
The tremendous advances in low-cost, high-capacity magnetic disk
drives have been among the key factors helping establish a modern
society that is deeply reliant on information technology. High-volume,
consumer-grade disk drives have become such a successful product that
their deployments range from home computers and appliances to
large-scale server farms. In 2002, for example, it was estimated that
over 90% of all new information produced was stored on magnetic
media, most of it being hard disk drives [12]. It is
therefore critical to improve our understanding of how robust these
components are and what main factors are associated with failures.
Such understanding can be particularly useful for guiding the design
of storage systems as well as devising deployment and maintenance
strategies.
Despite the importance of the subject, there are very few published
studies on failure characteristics of disk drives. Most of the
available information comes from the disk manufacturers themselves
[2]. Their data are typically based on extrapolation from
accelerated life test data of small populations or from returned unit
databases. Accelerated life tests, although useful in providing
insight into how some environmental factors can affect disk drive
lifetime, have been known to be poor predictors of actual failure
rates as seen by customers in the field [7]. Statistics
from returned units are typically based on much larger populations,
but since there is little or no visibility into the deployment
characteristics, the analysis lacks valuable insight into what
actually happened to the drive during operation. In addition, since
units are typically returned during the warranty period (often three
years or less), manufacturers' databases may not be as helpful for the
study of long-term effects.
A few recent studies have shed some light on field
failure behavior of disk drives [6,7,9,16,17,19,20]. However, these
studies have either reported on relatively modest populations or did
not monitor the disks closely enough during deployment to provide
insights into the factors that might be associated with failures.
Disk drives are generally very reliable but they are also very complex
components. This combination means that although they fail rarely,
when they do fail, the possible causes of failure can be numerous. As
a result, detailed studies of very large populations are the only way to
collect enough failure statistics to enable meaningful conclusions. In
this paper we present one such study by examining the population
of hard drives under deployment within Google's computing
infrastructure.
We have built an infrastructure that collects vital information about
all Google's systems every few minutes, and a repository that stores
these data in time-series format (essentially forever) for further
analysis. The information collected includes environmental factors
(such as temperatures), activity levels and many of the
Self-Monitoring Analysis and Reporting Technology (SMART) parameters
that are believed to be good indicators of disk drive health. We mine
through these data and attempt to find evidence that corroborates or
contradicts many of the commonly held beliefs about how various
factors can affect disk drive lifetime.
Our paper is unique in that it is based on data from a disk population
size that is typically only available from vendor warranty databases,
but has the depth of deployment visibility and detailed lifetime
follow-up that only an end-user study can provide. Our key
findings are:
- Contrary to previously reported results, we found very little
correlation between failure rates and either elevated temperature or
activity levels.
- Some SMART
parameters (scan errors, reallocation counts, offline reallocation
counts, and probational counts) have a large impact on failure
probability.
- Given the lack of occurrence of predictive SMART signals on a
large fraction of failed drives, it is unlikely that an accurate
predictive failure model can be built based on these signals alone.
2 Background
In this section we describe the infrastructure that was used to gather
and process the data used in this study, the types of disk drives
included in the analysis, and information on how they are deployed.
2.1 The System Health Infrastructure
The System Health infrastructure is a large distributed software
system that collects and stores hundreds of attribute-value pairs from all of
Google's servers, and provides the interface for arbitrary analysis jobs to
process that data.
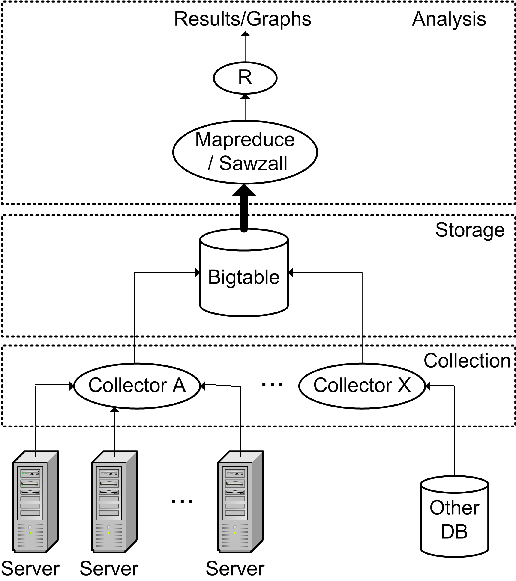 Figure 1: Collection, storage, and analysis architecture.
The architecture of the System Health infrastructure is shown in
Figure 1. It consists of a data collection layer, a
distributed repository and an analysis framework.
The collection layer is responsible for getting information from each of
thousands of individual servers into a centralized repository. Different
flavors of collectors exist to gather different types of data. Much of the
health information is obtained from the machines directly. A daemon runs on
every machine and gathers local data related to that machine's health, such
as environmental parameters, utilization information of various resources,
error indications, and configuration information. It is imperative that this
daemon's resource usage be very light, so not to interfere with the
applications. One way to assure this is to have the machine-level
collector poll individual machines relatively infrequently (every few minutes).
Other slower changing data (such as configuration information) and data from
other existing databases can be collected even less frequently than that.
Most notably for this study, data regarding machine repairs and disk swaps
are pulled in from another database.
The System Health database is built upon Bigtable [3], a
distributed data repository widely used within Google, which itself
is built upon the Google File System (GFS) [8]. Bigtable takes
care of all the data layout, compression, and access chores associated
with a large data store. It presents the abstraction of a 2-dimensional table
of data cells, with different versions over time making up a third
dimension. It is a natural fit for keeping track of the values of
different variables (columns) for different machines (rows) over
time. The System Health database thus retains a complete time-ordered
history of the environment, utilization, error, configuration, and
repair events in each machine's life.
Analysis programs run on top of the System Health database, looking at
information from individual machines, or mining the data across
thousands of machines. Large-scale analysis programs are typically
built upon Google's Mapreduce [5] framework. Mapreduce
automates the mechanisms of large-scale distributed computation (such
as work distribution, load balancing, tolerance of failures), allowing
the user to focus simply on the algorithms that make up the heart of
the computation.
The analysis pipeline used for this study consists of a Mapreduce job
written in the Sawzall language and framework [15] to
extract and clean up periodic SMART data and repair data related to
disks, followed by a pass through R [1] for statistical analysis
and final graph generation.
2.2 Deployment Details
The data in this study are collected from a large number of disk
drives, deployed in several types of systems across all of Google's
services. More than one hundred thousand disk drives were used for all the
results presented here. The disks are a combination of serial and
parallel ATA consumer-grade hard disk drives, ranging in speed from
5400 to 7200 rpm, and in size from 80 to 400 GB. All units in this
study were put into production in or after 2001. The population
contains several models from many of the largest disk drive
manufacturers and from at least nine different models. The data used
for this study were collected between December 2005 and August 2006.
As is common in server-class deployments, the disks were powered on,
spinning, and generally in service for essentially all of their
recorded life. They were deployed in rack-mounted servers and housed
in professionally-managed datacenter facilities.
Before being put into production, all disk drives go through a short
burn-in process, which consists of a combination of read/write stress
tests designed to catch many of the most common assembly,
configuration, or component-level problems. The data shown here do not
include the fall-out from this phase, but instead begin when the
systems are officially commissioned for use. Therefore our data should
be consistent with what a regular end-user should see, since most
equipment manufacturers put their systems through similar tests before
shipment.
2.3 Data Preparation
Definition of Failure. Narrowly defining what
constitutes a failure is a difficult task in such a large
operation. Manufacturers and end-users often see different statistics
when computing failures since they use different definitions for it.
While drive manufacturers often quote yearly failure rates below 2%
[2], user studies have seen rates as high as 6%
[9]. Elerath and Shah [7] report between
15-60% of drives considered to have failed at the user site are found
to have no defect by the manufacturers upon returning the unit. Hughes
et al. [11] observe between 20-30% "no problem
found" cases after analyzing failed drives from their study of 3477
disks.
From an end-user's perspective, a defective drive is one that
misbehaves in a serious or consistent enough manner in the user's
specific deployment scenario that it is no longer suitable for
service. Since failures are sometimes the result of a combination of
components (i.e., a particular drive with a particular controller or
cable, etc), it is no surprise that a good number of drives that fail
for a given user could be still considered operational in a different
test harness. We have observed that phenomenon ourselves, including
situations where a drive tester consistently "green lights" a unit
that invariably fails in the field. Therefore, the most accurate
definition we can present of a failure event for our study is: a
drive is considered to have failed if it was replaced as part of a
repairs procedure. Note that this definition implicitly excludes
drives that were replaced due to an upgrade.
Since it is not always clear when exactly a drive failed, we consider
the time of failure to be when the drive was replaced, which can
sometimes be a few days after the observed failure event. It is also
important to mention that the parameters we use in this study were not
in use as part of the repairs diagnostics procedure at the time that
these data were collected. Therefore there is no risk of false (forced)
correlations between these signals and repair outcomes.
Filtering. With such a large number of units monitored
over a long period of time, data integrity issues invariably show up.
Information can be lost or corrupted along our collection pipeline.
Therefore, some cleaning up of the data is necessary. In the case of
missing values, the individual values are marked as not available and
that specific piece of data is excluded from the detailed
studies. Other records for that same drive are not discarded.
In cases where the data are clearly spurious, the entire record for
the drive is removed, under the assumption that one piece of spurious
data draws into question other fields for the same drive. Identifying
spurious data, however, is a tricky task. Because part of the goal of
studying the data is to learn what the numbers mean, we must be
careful not to discard too much data that might appear invalid. So we
define spurious simply as negative counts or data values that are
clearly impossible. For example, some drives have reported
temperatures that were hotter than the surface of the sun. Others have
had negative power cycles. These were deemed spurious and removed. On
the other hand, we have not filtered any suspiciously large counts
from the SMART signals, under the hypothesis that large counts, while
improbable as raw numbers, are likely to be good indicators of
something really bad with the drive. Filtering for spurious values
reduced the sample set size by less than 0.1%.
3 Results
We now analyze the failure behavior of our fleet of disk drives using detailed
monitoring data collected over a nine-month observation window. During this
time we recorded failure events as well as all the available environmental and
activity data and most of the SMART parameters from the drives themselves.
Failure information spanning a much longer interval (approximately five years)
was also mined from an older repairs database. All the results presented here
were tested for their statistical significance using the appropriate
tests.
3.1 Baseline Failure Rates
Figure 2 presents the average Annualized Failure Rates
(AFR) for all drives in our study, aged zero to 5 years, and is
derived from our older repairs database. The data are broken down by
the age a drive was when it failed. Note that this implies some
overlap between the sample sets for the 3-month, 6-month, and 1-year
ages, because a drive can reach its 3-month, 6-month and 1-year age
all within the observation period. Beyond 1-year there is no more
overlap.
While it may be tempting to read this graph as strictly failure rate
with drive age, drive model factors are strongly mixed into these data
as well. We tend to source a particular drive model only for a
limited time (as new, more cost-effective models are constantly being
introduced), so it is often the case that when we look at sets of
drives of different ages we are also looking at a very different mix
of models. Consequently, these data are not directly useful in
understanding the effects of disk age on failure rates (the exception
being the first three data points, which are dominated by a relatively
stable mix of disk drive models). The graph is nevertheless a good way
to provide a baseline characterization of failures across our
population. It is also useful for later studies in the paper, where
we can judge how consistent the impact of a given parameter is across
these diverse drive model groups. A consistent and noticeable impact
across all groups indicates strongly that the signal being measured
has a fundamentally powerful correlation with failures, given that it
is observed across widely varying ages and models.
The observed range of AFRs (see Figure 2) varies from
1.7%, for drives that were in their first year of operation, to over
8.6%, observed in the 3-year old population. The higher baseline AFR
for 3 and 4 year old drives is more strongly influenced by the
underlying reliability of the particular models in that vintage than
by disk drive aging effects. It is interesting to note that our
3-month, 6-months and 1-year data points do seem to indicate a
noticeable influence of infant mortality phenomena, with 1-year AFR
dropping significantly from the AFR observed in the first three
months.
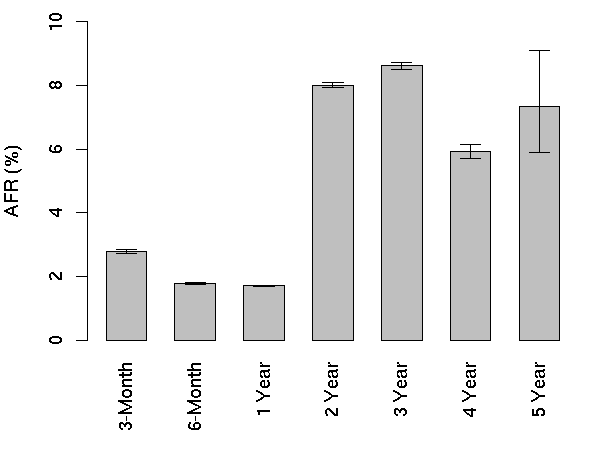 Figure 2: Annualized failure rates broken down by age groups
3.2 Manufacturers, Models, and Vintages
Failure rates are known to be highly correlated with drive models,
manufacturers and vintages [18]. Our results do not
contradict this fact. For example, Figure 2 changes
significantly when we normalize failure rates per each drive
model. Most age-related results are impacted by drive
vintages. However, in this paper, we do not show a breakdown of drives
per manufacturer, model, or vintage due to the proprietary nature of
these data.
Interestingly, this does not change our conclusions. In contrast to
age-related results, we note that all results shown in the rest of the
paper are not affected significantly by the population mix. None
of our SMART data results change significantly when normalized by
drive model. The only exception is seek error rate, which is dependent
on one specific drive manufacturer, as we discuss in section
3.5.5.
3.3 Utilization
The literature generally refers to utilization metrics by employing
the term duty cycle which unfortunately has no consistent and precise
definition, but can be roughly characterized as the fraction of time a
drive is active out of the total powered-on time. What is widely
reported in the literature is that higher duty cycles affect disk
drives negatively [4,21].
It is difficult for us to arrive at a meaningful numerical utilization
metric given that our measurements do not provide enough detail to
derive what 100% utilization might be for any given disk model. We
choose instead to measure utilization in terms of weekly averages of
read/write bandwidth per drive. We categorize utilization in three
levels: low, medium and high, corresponding respectively to the lowest
25th percentile, 50-75th percentiles and top 75th percentile. This
categorization is performed for each drive model, since the maximum
bandwidths have significant variability across drive families. We note
that using number of I/O operations and bytes transferred as
utilization metrics provide very similar results. Figure
3 shows the impact of utilization on AFR across
the different age groups.
Overall, we expected to notice a very strong and consistent
correlation between high utilization and higher failure rates. However
our results appear to paint a more complex picture. First, only very
young and very old age groups appear to show the expected
behavior. After the first year, the AFR of high utilization drives is
at most moderately higher than that of low utilization drives. The
three-year group in fact appears to have the opposite of the expected
behavior, with low utilization drives having slightly higher failure
rates than high utilization ones.
One possible explanation for this behavior is the survival of the
fittest theory. It is possible that the failure modes that are
associated with higher utilization are more prominent early in the
drive's lifetime. If that is the case, the drives that survive the
infant mortality phase are the least susceptible to that failure mode,
and result in a population that is more robust with respect to
variations in utilization levels.
Another possible explanation is that previous observations of high
correlation between utilization and failures has been based on
extrapolations from manufacturers' accelerated life experiments. Those
experiments are likely to better model early life failure
characteristics, and as such they agree with the trend we observe for
the young age groups. It is possible, however, that longer term
population studies could uncover a less pronounced effect later in a
drive's lifetime.
When we look at these results across individual models we again see a
complex pattern, with varying patterns of failure behavior across the
three utilization levels. Taken as a whole, our data indicate a much
weaker correlation between utilization levels and failures than
previous work has suggested.
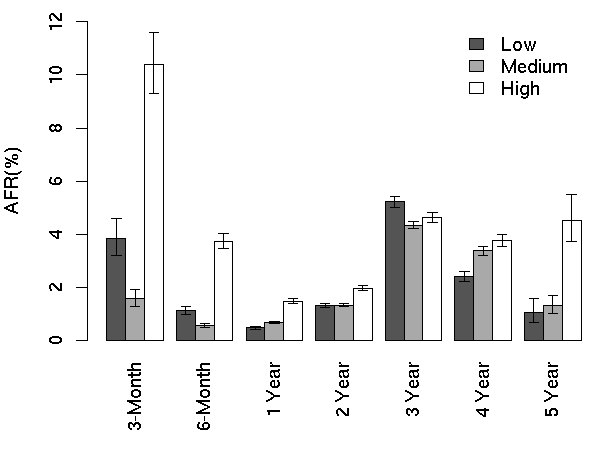 Figure 3: Utilization AFR
3.4 Temperature
Temperature is often quoted as the most important environmental factor
affecting disk drive reliability. Previous studies have indicated
that temperature deltas as low as 15C can nearly double disk drive
failure rates [4]. Here we take temperature readings from the SMART
records every few minutes during the entire 9-month window of
observation and try to understand the correlation between temperature
levels and failure rates.
We have aggregated temperature readings in several different ways,
including averages, maxima, fraction of time spent above a given
temperature value, number of times a temperature threshold is crossed,
and last temperature before failure. Here we report data on averages
and note that other aggregation forms have shown similar trends and
and therefore suggest the same conclusions.
We first look at the correlation between average temperature during
the observation period and failure. Figure 4 shows
the distribution of drives with average temperature in increments of
one degree and the corresponding annualized failure rates. The figure
shows that failures do not increase when the average temperature
increases. In fact, there is a clear trend showing that lower
temperatures are associated with higher failure rates. Only at very
high temperatures is there a slight reversal of this trend.
Figure 5 looks at the average temperatures
for different age groups. The distributions are in sync with Figure
4 showing a mostly flat failure rate at mid-range
temperatures and a modest increase at the low end of the temperature
distribution. What stands out are the 3 and 4-year old drives, where
the trend for higher failures with higher temperature is much more
constant and also more pronounced.
Overall our experiments can confirm previously reported temperature
effects only for the high end of our temperature range and especially
for older drives. In the lower and middle temperature ranges, higher
temperatures are not associated with higher failure
rates. This is a fairly surprising result, which could indicate that
datacenter or server designers have more freedom than previously
thought when setting operating temperatures for equipment that
contains disk drives. We can conclude that at moderate temperature
ranges it is likely that there are other effects which affect failure
rates much more strongly than temperatures do.
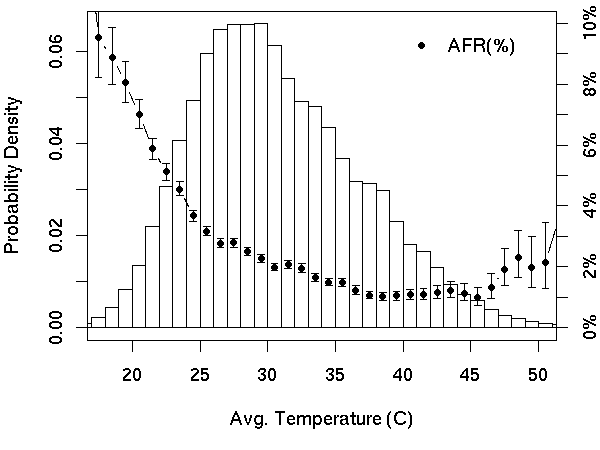 Figure 4: Distribution of average temperatures and failures rates.
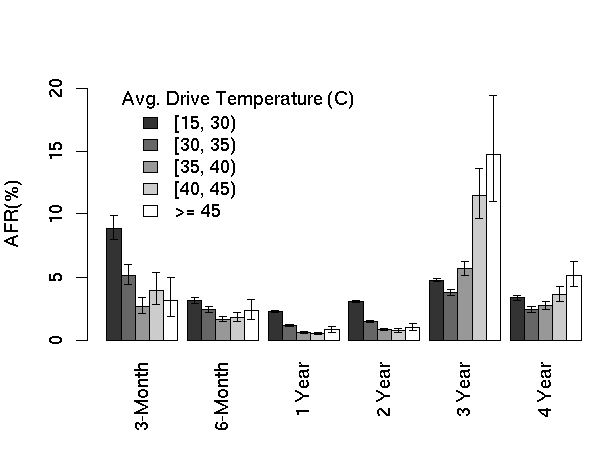 Figure 5: AFR for average drive temperature.
3.5 SMART Data Analysis
We now look at the various self-monitoring signals that are available
from virtually all of our disk drives through the SMART standard
interface. Our analysis indicates that some signals appear to be more
relevant to the study of failures than others. We first look at those
in detail, and then list a summary of our findings for the remaining
ones. At the end of this section we discuss our results and reason
about the usefulness of SMART parameters in obtaining predictive
models for individual disk drive failures.
We present results in three forms. First we compare the AFR of drives
with zero and non-zero counts for a given parameter, broken down by
the same age groups as in figures 2 and
3. We also find it useful to plot the probability
of survival of drives over the nine-month observation window for
different ranges of parameter values. Finally, in addition to the
graphs, we devise a single metric that could relay how relevant the
values of a given SMART parameter are in predicting imminent failures.
To that end, for each SMART parameter we look for thresholds that
increased the probability of failure in the next 60 days by at least a
factor of 10 with respect to drives that have zero counts for that
parameter. We report such Critical Thresholds whenever we are
able to find them with high confidence ( > 95%).
3.5.1 Scan Errors
Drives typically scan the disk surface in the background and report
errors as they discover them. Large scan error counts can be
indicative of surface defects, and therefore are believed to be
indicative of lower reliability. In our population, fewer than 2% of
the drives show scan errors and they are nearly uniformly spread
across various disk models.
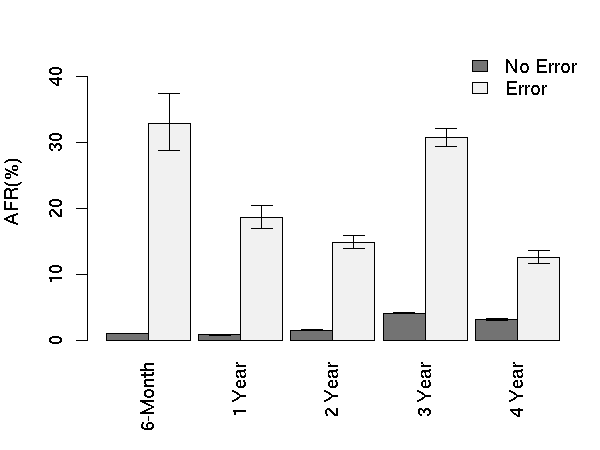 Figure 6: AFR for scan errors.
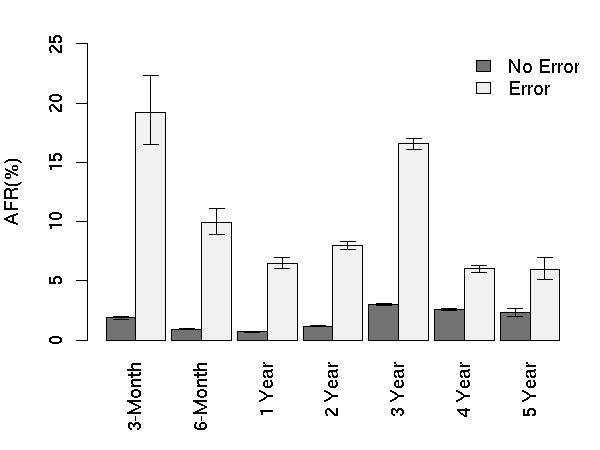 Figure 7: AFR for reallocation counts.
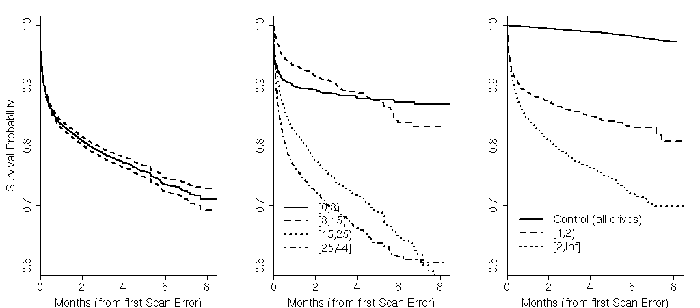 Figure 8: Impact of scan errors on survival probability. Left
figure shows aggregate survival probability for all drives after
first scan error. Middle figure breaks down survival probability
per drive ages in months. Right figure breaks down drives by their
number of scan errors.
Figure 8: Impact of scan errors on survival probability. Left
figure shows aggregate survival probability for all drives after
first scan error. Middle figure breaks down survival probability
per drive ages in months. Right figure breaks down drives by their
number of scan errors.
Figure 6 shows the AFR values of two groups of
drives, those without scan errors and those with one or more. We plot
bars across all age groups in which we have statistically significant
data. We find that the group of drives with scan errors are ten times
more likely to fail than the group with no errors. This effect is
also noticed when we further break down the groups by disk model.
From Figure 8 we see a drastic and quick
decrease in survival probability after the first scan error (left
graph). A little over 70% of the drives survive the first 8 months
after their first scan error. The dashed lines represent the 95%
confidence interval. The middle plot in Figure
8 separates the population in four age groups
(in months), and shows an effect that is not visible in the AFR
plots. It appears that scan errors affect the survival probability of
young drives more dramatically very soon after the first scan error
occurs, but after the first month the curve flattens out. Older
drives, however, continue to see a steady decline in survival
probability throughout the 8-month period. This behavior could be
another manifestation of infant mortality phenomenon. The right graph
in figure 8 looks at the effect of multiple
scan errors. While drives with one error are more likely to fail than
those with none, drives with multiple errors fail even more quickly.
The critical threshold analysis confirms what the charts visually
imply: the critical threshold for scan errors is one. After the first
scan error, drives are 39 times more likely to fail within 60 days
than drives without scan errors.
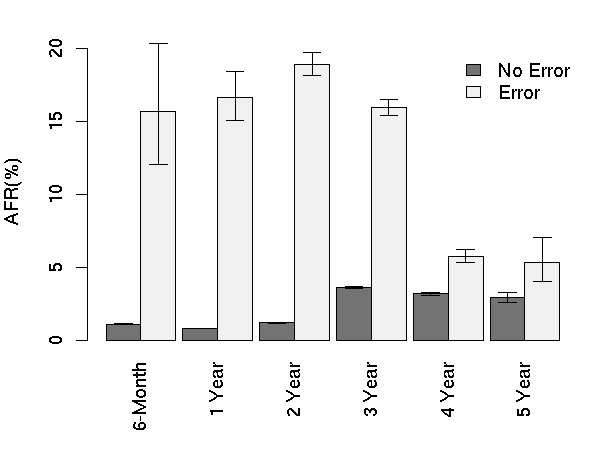 Figure 9: AFR for offline reallocation count.
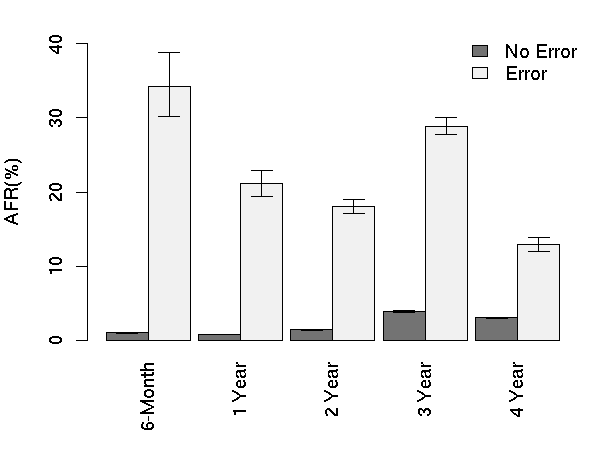 Figure 10: AFR for probational count.
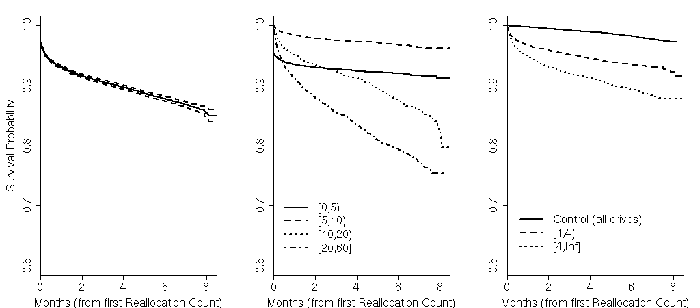 Figure 11: Impact of reallocation count values on survival
probability. Left figure shows aggregate survival probability for
all drives after first reallocation. Middle figure breaks down
survival probability per drive ages in months. Right figure breaks
down drives by their number of reallocations.
Figure 11: Impact of reallocation count values on survival
probability. Left figure shows aggregate survival probability for
all drives after first reallocation. Middle figure breaks down
survival probability per drive ages in months. Right figure breaks
down drives by their number of reallocations.
3.5.2 Reallocation Counts
When the drive's logic believes that a sector is damaged (typically as
a result of recurring soft errors or a hard error) it can remap the
faulty sector number to a new physical sector drawn from a pool of
spares. Reallocation counts reflect the number of times this has
happened, and is seen as an indication of drive surface wear. About
9% of our population has reallocation counts greater than
zero. Although some of our drive models show higher absolute values
than others, the trends we observe are similar across all models.
As with scan errors, the presence of reallocations seems to have a
consistent impact on AFR for all age groups (Figure
7), even if slightly less pronounced. Drives
with one or more reallocations do fail more often than those with
none. The average impact on AFR appears to be between a factor of
3-6x.
Figure 11 shows the survival probability
after the first reallocation. We truncate the graph to 8.5 months, due
to a drastic decrease in the confidence levels after that point. In
general, the left graph shows, about 85% of the drives survive past 8
months after the first reallocation. The effect is more pronounced
(middle graph) for drives in the age ranges [10,20) and [20, 60]
months, while newer drives in the range [0,5) months suffer more than
their next generation. This could again be due to infant mortality
effects, although it appears to be less drastic in this case than for
scan errors.
After their first reallocation, drives are over 14 times more likely
to fail within 60 days than drives without reallocation counts, making
the critical threshold for this parameter also one.
3.5.3 Offline Reallocations
Offline reallocations are defined as a subset of the reallocation
counts studied previously, in which only reallocated sectors found
during background scrubbing are counted. In other words, it should
exclude sectors that are reallocated as a result of errors found
during actual I/O operations. Although this definition mostly holds,
we see evidence that certain disk models do not implement this
definition. For instance, some models show more offline reallocations
than total reallocations. Since the impact of offline reallocations
appears to be significant and not identical to that of total
reallocations, we decided to present it separately (Figure
9). About 4% of our population shows non-zero values for
offline reallocations, and they tend to be concentrated on a
particular subset of drive models.
Overall, the effects on survival probability of offline reallocation
seem to be more drastic than those of total reallocations, as seen in
Figure 12 (as before, some curves are clipped
at 8 months because our data for those points were not within high
confidence intervals). Drives in the older age groups appear to be
more highly affected by it, although we are unable to attribute this
effect to age given the different model mixes in the various age
groups.
After the first offline reallocation, drives have over 21 times higher
chances of failure within 60 days than drives without offline
reallocations; an effect that is again more drastic than total
reallocations.
Our data suggest that, although offline reallocations could be an
important parameter affecting failures, it is particularly important
to interpret trends in these values within specific models, since
there is some evidence that different drive models may classify
reallocations differently.
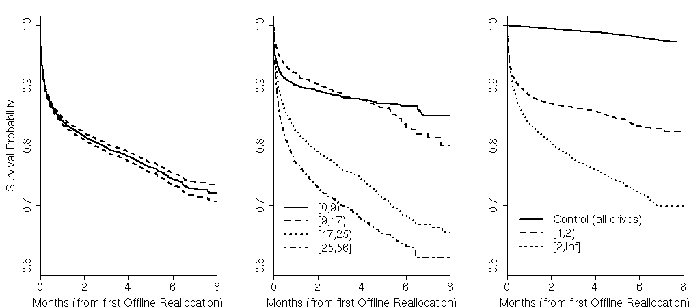 Figure 12: Impact of offline reallocation on survival
probability. Left figure shows aggregate survival probability for
all drives after first offline reallocation. Middle figure breaks
down survival probability per drive ages in months. Right figure
breaks down drives by their number offline reallocation.
Figure 12: Impact of offline reallocation on survival
probability. Left figure shows aggregate survival probability for
all drives after first offline reallocation. Middle figure breaks
down survival probability per drive ages in months. Right figure
breaks down drives by their number offline reallocation.
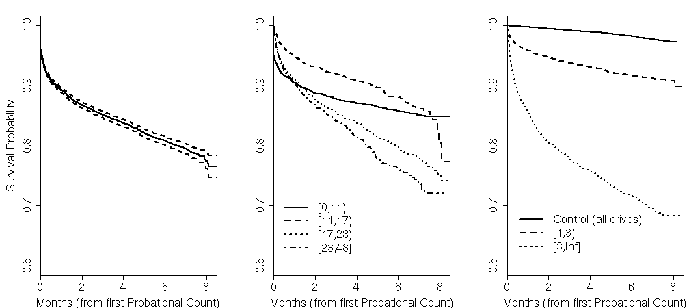 Figure 13: Impact of probational count values on survival
probability. Left figure shows aggregate survival probability for
all drives after first probational count. Middle figure breaks down
survival probability per drive ages in months. Right figure breaks
down drives by their number of probational counts.
Figure 13: Impact of probational count values on survival
probability. Left figure shows aggregate survival probability for
all drives after first probational count. Middle figure breaks down
survival probability per drive ages in months. Right figure breaks
down drives by their number of probational counts.
3.5.4 Probational Counts
Disk drives put suspect bad sectors "on probation" until they either
fail permanently and are reallocated or continue to work without
problems. Probational counts, therefore, can be seen as a softer error
indication. It could provide earlier warning of possible problems but
might also be a weaker signal, in that sectors on probation may indeed
never be reallocated. About 2% of our drives had non-zero probational
count values. We note that this number is lower than both online and
offline reallocation counts, likely indicating that sectors may be
removed from probation after further observation of their
behavior. Once more, the distribution of drives with non-zero
probational counts are somewhat skewed towards a subset of disk drive
models.
Figures 10 and 13 show that
probational count trends are generally similar to those observed for
offline reallocations, with age group being somewhat less
pronounced. The critical threshold for probational counts is also one:
after the first event, drives are 16 times more likely to fail within
60 days than drives with zero probational counts.
3.5.5 Miscellaneous Signals
In addition to the SMART parameters described in the previous
sections, which we have found to most closely impact failure rates, we
have also studied several other parameters from the SMART set as well
as other environmental factors. Here we briefly mention our relevant
findings for some of those parameters.
Seek Errors. Seek errors occur when a disk drive fails
to properly track a sector and needs to wait for another revolution to
read or write from or to a sector. Drives report it as a rate, and it
is meant to be used in combination with model-specific
thresholds. When examining our population, we find that seek errors
are widespread within drives of one manufacturer only, while others
are more conservative in showing this kind of errors. For this one
manufacturer, the trend in seek errors is not clear, changing from one
vintage to another. For other manufacturers, there is no correlation
between failure rates and seek errors.
CRC Errors. Cyclic redundancy check (CRC) errors are
detected during data transmission between the physical media and the
interface. Although we do observe some correlation between higher CRC
counts and failures, those effects are somewhat less pronounced. CRC
errors are less indicative of drive failures than that of cables and
connectors. About 2% of our population had CRC errors.
Power Cycles. The power cycles indicator counts the
number of times a drive is powered up and down. In a server-class
deployment, in which drives are powered continuously, we do not expect
to reach high enough power cycle counts to see any effects on failure
rates. Our results find that for drives aged up to two years, this is
true, there is no significant correlation between failures and high
power cycles count. But for drives 3 years and older, higher power
cycle counts can increase the absolute failure rate by over 2%. We
believe this is due more to our population mix than to aging
effects. Moreover, this correlation could be the effect (not the
cause) of troubled machines that require many repair iterations and
thus many power cycles to be fixed.
Calibration Retries. We were unable to reach a
consistent and clear definition of this SMART parameter from public
documents as well as consultations with some of the disk
manufacturers. Nevertheless, our observations do not indicate that
this is a particularly useful parameter for the goals of this
study. Under 0.3% of our drives have calibration retries, and of that
group only about 2% have failed, making this a very weak and
imprecise signal when compared with other SMART parameters.
Spin Retries. Counts the number of retries when the
drive is attempting to spin up. We did not register a single count
within our entire population.
Power-on hours Although we do not dispute that
power-on hours might have an effect on drive lifetime, it happens that
in our deployment the age of the drive is an excellent approximation
for that parameter, given that our drives remain powered on for most
of their life time.
Vibration This is not a parameter that is part of the
SMART set, but it is one that is of general concern in designing drive
enclosures as most manufacturers describe how vibration can affect
both performance and reliability of disk drives. Unfortunately we do
not have sensor information to measure this effect directly for drives
in service. We attempted to indirectly infer vibration effects by
considering the differences in failure rates between systems with a
single drive and those with multiple drives, but those experiments
were not controlled enough for other possible factors to allow us to
reach any conclusions.
3.5.6 Predictive Power of SMART Parameters
Given how strongly correlated some SMART parameters were found to
be with higher failure rates, we were hopeful that accurate predictive
failure models based on SMART signals could be created.
Predictive models are very useful in
that they can reduce service disruption due to failed components and
allow for more efficient scheduled maintenance processes to replace
the less efficient (and reactive) repairs procedures. In fact, one of
the main motivations for SMART was to provide enough insight into disk
drive behavior to enable such models to be built.
After our initial attempts to derive such models yielded
relatively unimpressive results, we turned to the question of what
might be the upper bound of the accuracy of any model based solely on
SMART parameters. Our results are surprising, if not somewhat
disappointing. Out of all failed drives, over 56% of them have no
count in any of the four strong SMART signals, namely scan errors,
reallocation count, offline reallocation, and probational count. In
other words, models based only on those signals can never predict more
than half of the failed drives. Figure 14
shows that even when we add all remaining SMART parameters (except
temperature) we still find that over 36% of all failed drives had
zero counts on all variables. This population includes seek error
rates, which we have observed to be widespread in our population ( >
72% of our drives have it) which further reduces the sample size of
drives without any errors.
It is difficult to add temperature to this analysis since despite it
being reported as part of SMART there are no crisp thresholds that
directly indicate errors. However, if we arbitrarily assume that
spending more than 50% of the observed time above 40C is an
indication of possible problem, and add those drives to the set of
predictable failures, we still are left with about 36% of all drives
with no failure signals at all. Actual useful models, which need to
have small false-positive rates are in fact likely to do much worse
than these limits might suggest.
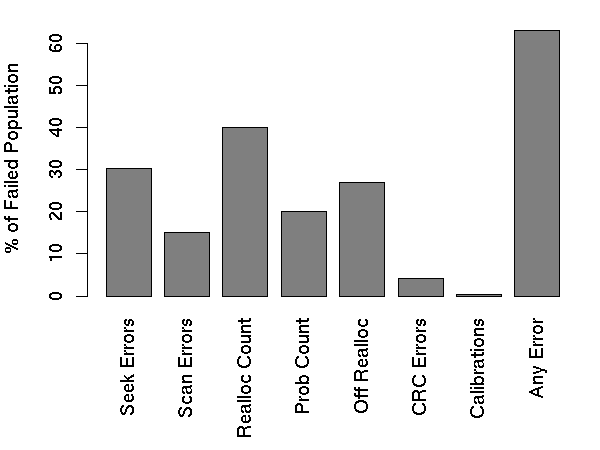 Figure 14: Percentage of failed drives with SMART errors.
We conclude that it is unlikely that SMART data alone can be
effectively used to build models that predict failures of individual
drives. SMART parameters still appear to be useful in reasoning about
the aggregate reliability of large disk populations, which is still
very important for logistics and supply-chain planning. It is
possible, however, that models that use parameters beyond those
provided by SMART could achieve significantly better accuracies. For
example, performance anomalies and other application or operating
system signals could be useful in conjunction with SMART data to
create more powerful models. We plan to explore this possibility in
our future work.
4 Related Work
Previous studies in this area generally fall into two categories:
vendor (disk drive or storage appliance) technical papers and user
experience studies. Disk vendors studies provide valuable insight into
the electro-mechanical characteristics of disks and both model-based
and experimental data that suggests how several environmental factors
and usage activities can affect device lifetime. Yang and Sun
[21] and Cole [4] describe the processes and
experimental setup used by Quantum and Seagate to test new units and
the models that attempt to make long-term reliability predictions
based on accelerated life tests of small populations. Power-on-hours,
duty cycle, temperature are identified as the key deployment
parameters that impact failure rates, each of them having the
potential to double failure rates when going from nominal to extreme
values. For example, Cole presents thermal de-rating models showing
that MTBF could degrade by as much as 50% when going from operating
temperatures of 30C to 40C. Cole's report also presents yearly failure
rates from Seagate's warranty database, indicating a linear decrease
in annual failure rates from 1.2% in the first year to 0.39% in the
third (and last year of record). In our study, we did not find much
correlation between failure rate and either elevated temperature or
utilization. It is the most surprising result of our study. Our
annualized failure rates were generally higher than those reported by
vendors, and more consistent with other user experience studies.
Shah and Elerath have written several papers based on the behavior of
disk drives inside Network Appliance storage products [6,7,19]. They use a reliability database that includes
field failure statistics as well as support logs, and their position
as an appliance vendor enables them more control and visibility into
actual deployments than a typical disk drive vendor might
have. Although they do not report directly on the correlation between
SMART parameters or environmental factors and failures (possibly for
confidentiality concerns), their work is useful in enabling a
qualitative understanding of factors what affect disk drive
reliability. For example, they comment that end-user failure rates
can be as much as ten times higher than what the drive manufacturer
might expect [7]; they report in [6] a
strong experimental correlation between number of heads and higher
failure rates (an effect that is also predicted by the models in
[4]); and they observe that different failure mechanisms
are at play at different phases of a drive lifetime
[19]. Generally, our findings are in line with these results.
User experience studies may lack the depth of insight into the device
inner workings that is possible in manufacturer reports, but they are
essential in understanding device behavior in real-world
deployments. Unfortunately, there are very few such studies to date,
probably due to the large number of devices needed to observe
statistically significant results and the complex infrastructure
required to track failures and their contributing factors.
Talagala and Patterson [20] perform a detailed error
analysis of 368 SCSI disk drives over an eighteen month period,
reporting a failure rate of 1.9%. Results on a larger number of
desktop-class ATA drives under deployment at the Internet Archive are
presented by Schwarz et al [17]. They report on a
2% failure rate for a population of 2489 disks during 2005, while
mentioning that replacement rates have been as high as 6% in the
past. Gray and van Ingen [9] cite observed failure
rates ranging from 3.3-6% in two large web properties with 22,400 and
15,805 disks respectively.
A recent study by Schroeder and Gibson [16] helps shed light
into the statistical properties of disk drive failures. The study uses
failure data from several large scale deployments, including a large
number of SATA drives. They report a significant overestimation of mean
time to failure by manufacturers and a lack of infant mortality effects.
None of these user studies have attempted to correlate failures with SMART
parameters or other environmental factors.
We are aware of two groups that have attempted to correlate SMART
parameters with failure statistics. Hughes et al [11,13,14] and Hamerly and Elkan [10]. The largest
populations studied by these groups was of 3744 and 1934 drives and
they derive failure models that achieve predictive rates as high as
30%, at false positive rates of about 0.2% (that false-positive rate
corresponded to a number of drives between 20-43% of the drives that
actually failed in their studies). Hughes et al. also cites an
annualized failure rate of 4-6%, based on their 2-3 month long
experiment which appears to use stress test logs provided by a disk
manufacturer.
Our study takes a next step towards a better understanding of disk
drive failure characteristics by essentially combining some of the
best characteristics of studies from vendor database analysis, namely
population size, with the kind of visibility into a real-world
deployment that is only possible with end-user data.
5 Conclusions
In this study we report on the failure characteristics of
consumer-grade disk drives. To our knowledge, the study is
unprecedented in that it uses a much larger population size than has
been previously reported and presents a comprehensive analysis of the
correlation between failures and several parameters that are believed
to affect disk lifetime. Such analysis is made possible by a new
highly parallel health data collection and analysis infrastructure,
and by the sheer size of our computing deployment.
One of our key findings has been the lack of a consistent pattern of
higher failure rates for higher temperature drives or for those drives
at higher utilization levels. Such correlations have been repeatedly
highlighted by previous studies, but we are unable to confirm them by
observing our population. Although our data do not allow us to
conclude that there is no such correlation, it provides strong
evidence to suggest that other effects may be more prominent in
affecting disk drive reliability in the context of a professionally
managed data center deployment.
Our results confirm the findings of previous smaller population
studies that suggest that some of the SMART parameters are
well-correlated with higher failure probabilities. We find, for
example, that after their first scan error, drives are 39 times more
likely to fail within 60 days than drives with no such
errors. First errors in reallocations, offline reallocations, and
probational counts are also strongly correlated to higher failure
probabilities. Despite those strong correlations, we find that
failure prediction models based on SMART parameters alone are likely
to be severely limited in their prediction accuracy, given that a
large fraction of our failed drives have shown no SMART error signals
whatsoever. This result suggests that SMART models are more useful in
predicting trends for large aggregate populations than for individual
components. It also suggests that powerful predictive models need to
make use of signals beyond those provided by SMART.
Acknowledgments
We wish to acknowledge the contribution of numerous Google colleagues,
particularly in the Platforms and Hardware Operations teams,
who made this study possible, directly or indirectly; among them:
Xiaobo Fan, Greg Slaughter, Don Yang, Jeremy Kubica, Jim Winget, Caio
Villela, Justin Moore, Henry Green, Taliver Heath, and Walt Drummond.
We are also thankful to our shepherd, Mary Baker for comments and guidance.
A special thanks to Urs Hölzle for his extensive feedback on our drafts.
References
- [1]
-
The r project for statistical computing.
https://www.r-project.org.
- [2]
-
Dave Anderson, Jim Dykes, and Erik Riedel.
More than an interface - scsi vs. ata.
In Proceedings of the 2nd USENIX Conference on File and Storage
Technologies (FAST'03), pages 245 - 257, February 2003.
- [3]
-
Fay Chang, Jeffrey Dean, Sanjay Ghemawat, Wilson C. Hsieh, Deborah A. Wallach,
Mike Burrows, Tushar Chandra, Andrew Fikes, and Robert E. Gruber.
Bigtable: A distributed storage system for structured data.
In Proceedings of the 7th USENIX Symposium on Operating Systems
Design and Implementation (OSDI'06), November 2006.
- [4]
-
Gerry Cole.
Estimating drive reliability in desktop computers and consumer
electronics systems.
Seagate Technology Paper TP-338.1, November 2000.
- [5]
-
Jeffrey Dean and Sanjay Ghemawat.
Mapreduce: Simplified data processing on large clusters.
In Proceedings of the 6th USENIX Symposium on Operating Systems
Design and Implementation (OSDI'04), pages 137 - 150, December 2004.
- [6]
-
Jon G. Elerath and Sandeep Shah.
Disk drive reliability case study: Dependence upon fly-height and
quantity of heads.
In Proceedings of the Annual Symposium on Reliability and
Maintainability, January 2003.
- [7]
-
Jon G. Elerath and Sandeep Shah.
Server class disk drives: How reliable are they?
In Proceedings of the Annual Symposium on Reliability and
Maintainability, pages 151 - 156, January 2004.
- [8]
-
Sanjay Ghemawat, Howard Gobioff, and Shun-Tak Leung.
The google file system.
In Proceedings of the 19th ACM Symposium on Operating Systems
Principles, pages 29 - 43, December 2003.
- [9]
-
Jim Gray and Catherine van Ingen.
Empirical measurements of disk failure rates and error rates.
Technical Report MSR-TR-2005-166, December 2005.
- [10]
-
Greg Hamerly and Charles Elkan.
Bayesian approaches to failure prediction for disk drives.
In Proceedings of the Eighteenth International Conference on
Machine Learning (ICML'01), June 2001.
- [11]
-
Gordon F. Hughes, Joseph F. Murray, Kenneth Kreutz-Delgado, and Charles Elkan.
Improved disk-drive failure warnings.
IEEE Transactions on Reliability, 51(3):350 - 357, September
2002.
- [12]
-
Peter Lyman and Hal R.Varian.
How much information?
October 2003.
https://www2.sims.berkeley.edu/
research/projects/how-much-info-2003/index.htm.
- [13]
-
Joseph F. Murray, Gordon F Hughes, and Kenneth Kreutz-Delgado.
Hard drive failure prediction using non-parametric statistical
methods.
Proceedings of ICANN/ICONIP, June 2003.
- [14]
-
Joseph F. Murray, Gordon F. Hughes, and Kenneth Kreutz-Delgado.
Machine learning methods for predicting failures in hard drives: A
multiple-instance application.
J. Mach. Learn. Res., 6:783-816, 2005.
- [15]
-
Rob Pike, Sean Dorward, Robert Griesemer, and Sean Quinlan.
Interpreting the data: Parallel analysis with sawzall.
Scientific Programming Journal, Special Issue on Grids and
Worldwide Computing Programming Models and Infrastructure, 13(4):227 - 298.
- [16]
-
Bianca Schroeder and Garth A. Gibson.
Disk failures in the real world: What does an mttf of 1,000,000 hours
mean to you?
In Proceedings of the 5th USENIX Conference on File and Storage
Technologies (FAST), February 2007.
- [17]
-
Thomas Schwartz, Mary Baker, Steven Bassi, Bruce Baumgart, Wayne Flagg,
Catherine van Ingen, Kobus Joste, Mark Manasse, and Mehul Shah.
Disk failure investigations at the internet archive.
14th NASA Goddard, 23rd IEEE Conference on Mass Storage Systems
and Technologies, May 2006.
- [18]
-
Sandeep Shah and Jon G. Elerath.
Disk drive vintage and its effect on reliability.
In Proceedings of the Annual Symposium on Reliability and
Maintainability, pages 163 - 167, January 2004.
- [19]
-
Sandeep Shah and Jon G. Elerath.
Reliability analysis of disk drive failure mechanisms.
In Proceedings of the Annual Symposium on Reliability and
Maintainability, pages 226 - 231, January 2005.
- [20]
-
Nisha Talagala and David Patterson.
An analysis of error behavior in a large storage system.
Technical Report CSD-99-1042, University of California,
Berkeley, February 1999.
- [21]
-
Jimmy Yang and Feng-Bin Sun.
A comprehensive review of hard-disk drive reliability.
In Proceedings of the Annual Symposium on Reliability and
Maintainability, pages 403 - 409, January 1999.
|